New Telemetry Chart: Tyre Surface Temperature Analysis

F1Laps now includes tyre surface temperature analysis in the telemetry suite. This new chart tracks temperature changes across all four tyres throughout your lap, giving you insights into how your driving and setup affect tyre performance.
What the Chart Shows
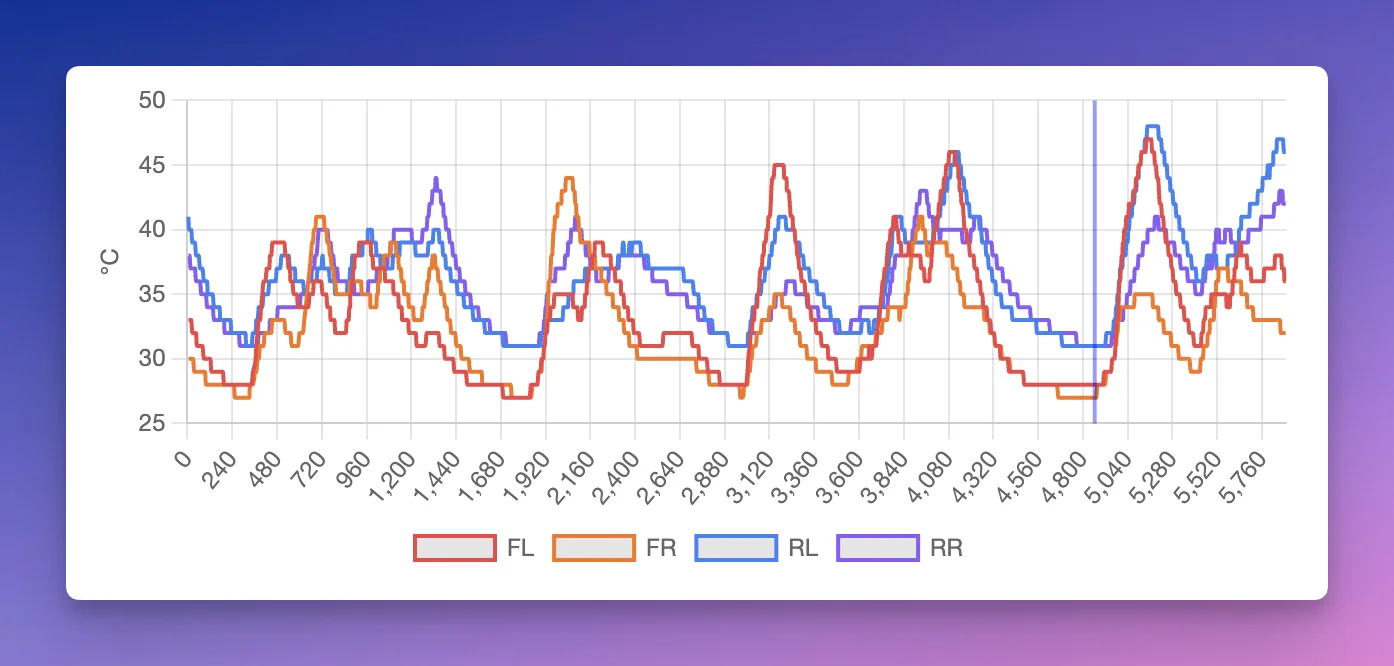
The tyre temperature chart displays surface temps for each wheel, color-coded for easy identification:
- Front-Left: Red
- Front-Right: Orange
- Rear-Left: Blue
- Rear-Right: Purple
Like all telemetry charts on F1Laps, the X-axis shows distance around the track in meters, letting you see exactly where temperatures rise or fall.
Why Tyre Temperatures Matter
Tyre temperatures directly affect grip and degradation. The new chart helps you:
- Identify problem corners: See which sections cause tyres to overheat
- Balance your setup: If one end runs consistently hotter, you may need to adjust downforce or camber
- Refine your driving: Aggressive inputs spike temperatures - compare your temps to faster laps to find where you're pushing too hard
- Plan strategy: Understanding thermal behavior helps predict when tyres will fall off
Lap Comparison
When comparing two laps, the chart shows your comparison lap with dashed lines. This makes it easy to spot differences in temperature management between your lap and a benchmark.
Where to Find It
Open any lap on F1Laps, scroll to the telemetry section, and you'll see the Tyre Temperature chart alongside Speed, Brake, Throttle, and the other telemetry data.
Availability
The tyre temperature chart is available to all F1Laps members with telemetry access as part of the existing telemetry suite.